Why are appeal success rates so low?
Appeal success rates are rebounding slightly with the overall average for all s73 appeals in Q3 being 26% of appeals allowed. This average hides significant variability, of which more below.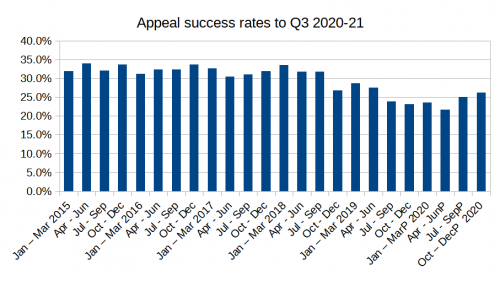
The long term trend in appeal success rates
Despite the recent uptick, appeal success rates are still well below the long-term average of 33% between 2010 and 2018. With the Q4 figures for the 2020/21 year still awaited, this year’s overall appeal success rate of 24.3% (based on Q1-Q3 figures) is still lower than the 24.5% overall success rate for the year 2019/20.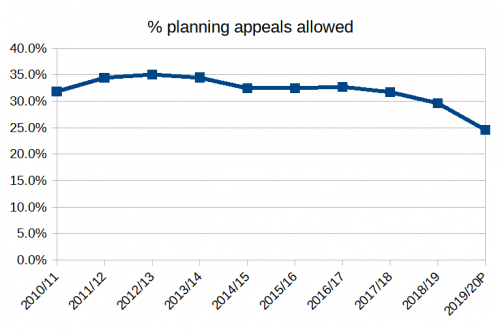
The Planning Inspectorate has considered it necessary to formally state that Inspectors have not been instructed to dismiss more appeals and to explain the possible reasons for the low success rate of appeals in a recent press release on their website.
We have independently assessed their figures. While it is true that hearings and inquiries have a higher success rate, as shown in the graph below, only a small proportion of appeals have ever been determined through these procedures. The falling number of hearings and inquiries in recent years may have brought the overall success rate down slightly, but does not explain why written representations appeals have had a declining success rate in recent years as shown in red on the graph below. 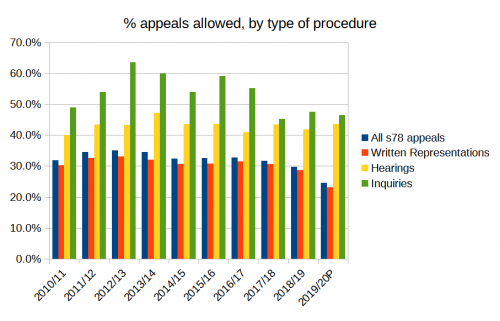
Written representations appeals, which now make up 95% of all appeals, have experienced a decline in success rates from 33% in 2012/13 to 23% in 2019/20. Why has there been a steady decline in success rates for the majority of appeals?
PINS state in their press release that, "The change in allowed rates coincides with the publication of the revised National Planning Policy Framework in July 2018. It is difficult to accurately assess the impact of this together with increasingly up-to-date local plan coverage but the greater emphasis on design quality in the revised Framework and the likelihood that more local planning authorities are able to demonstrate a 5 year housing land supply may have played their part." We would add that the re-assertion by the Courts that decisions must be "plan-led" has shifted the balance towards a more negative mindset.
Variability in planning appeal success rates
The Inspectorate notes that certain types of development might be having an impact on the overall appeal success rate. For example 7% of appeals over 2018-2020 involved telephone kiosks and their low appeal success rate of only 15% may have brought the overall figure down.
Our independent analysis of PINS statistics reveals that other types of development may have had a greater impact. For instance, 6% of appeals over 2018-2020 were either commercial or advertisement appeals with an average success rate of 37.5%, while 11.4% of appeals over 2018-2020 were either major residential developments or householder appeals with a combined average success rate of 36%. These types of appeals normally bolster the overall appeal success rate but in recent years they have fallen in number and therefore have less impact on the total figure.
Together major dwellings, householder, commerical and advertisement appeals comprised 25% of all appeals in 2015-16 but only 15% in 2019-20 as shown in the graph 'Number of appeals by type of development' below.
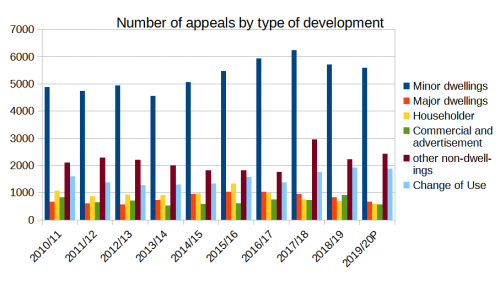
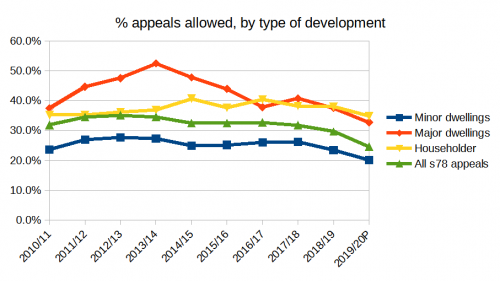
By far the largest number of appeals involve small residential developments of 1-9 dwellings and therefore appeal decisions for this type of development are the largest single influence on the overall downward trend.
Success rates for residential development appeals
Minor residential developments of 1-9 dwellings, which comprised 48% of all appeals in 2019/20, have the lowest success rates for residential developments.
2020-21 appeal success rates
The most recent figures including 3 quarters of 2020-21 up to December 2020 in the graph below show an increase in the overall appeal success rate (shown in green) up to 26% in Q3. However this should not obscure the continuing low success rate of minor developments involving 1-9 dwellings (in blue) where the figure was only 19% in Q3 2020-21.
Major residential developments and householder appeals had appeal success rates of 39% and 38% respectively in Q3 of 2020. This has helped boost the overall average for all s78 appeals but it should not obscure the fact that the majority of appeals for 1-9 dwellings continue to have a very low success rate.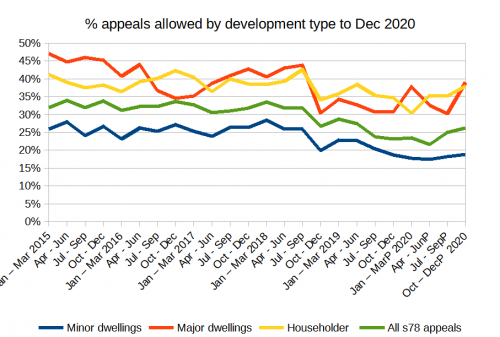
Spotlight on the Decision Makers?
There has been much speculation in the planning news about why appeal success rates have been declining. The statistics suggest the decline is across the board and particularly strong in the most common types of appeals. It is not easily explained by any single factor. A credible theory is that it reflects the changing profile of Planning Inspectors, with an increasing proportion being drawn from local authority backgrounds. Whatever the cause, we welcome the Inspectorate’s commitment to keep a close eye on appeal success statistics.
The latest Planning Inspectorate’s statistics can be found here.
You can compile your own statistics on areas of specific interest to you by interrogating our database of all appeal Decisions, using the search on our Home page.

