Planning appeal success rates and timescales
1. SUCCESS RATES
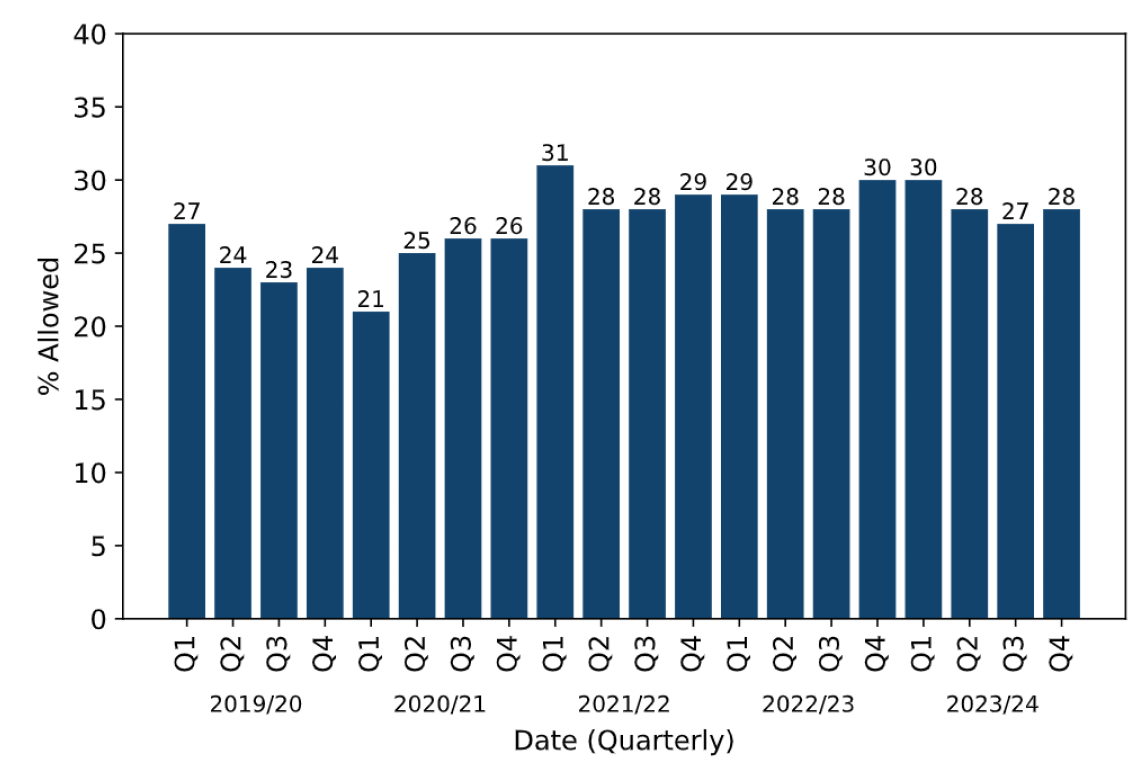
Planning appeal success rates over the past quarter January - March 2024 average 28%, according to the latest statistics issued by the Planning Inspectorate.
Figure 1. s78 planning appeal success rates by quarter for the past 5 years
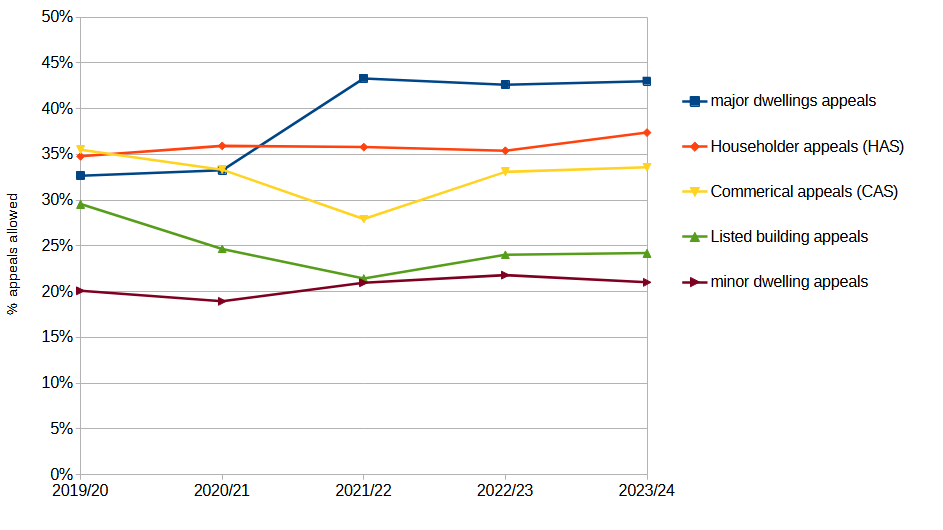
The overall average obscures differences between different types of development and different appeal procedures. Certain types of development are generally more successful on appeal than other types, for example, major applications for 10+ dwellings have double the success rate on appeal compared to minor applications for under 10 dwellings, as shown in figure 2 below. Householder development also has a significantly higher success rate on appeal than appeals involving listed buildings.
Figure 2. Percentage of appeals allowed by type of development
Appeal success rates for written reps, hearings and inquiries
Written representation appeals (aqua line in the graph below) make up 93% of planning appeals so the overall appeal success rate (yellow) closely mirrors the average for this procedure. The appeal success rates for Jan - March 2024 (Q4) were 27% for written representations appeals and 28% overall for all s78 planning appeals.
Appeals through the Hearings procedure (orange line in the graph below) had a higher success rate of 50% last quarter but comprise only 4% of s78 planning appeals. Inquiries (black line) had an appeal success rate of 48% last quarter but make up only 3% of s78 planning appeals.
Figure 3. s78 planning appeal success rates by procedure type

Tempting as it is to ask for a hearing or an inquiry, the Planning Inspectorate has strict criteria for deciding when these procedures can be used, which can be found in Annex K of the PINS Planning Appeals Procedural Guide.
2. TIMESCALES
For written representations appeals, the median number of weeks from an appeal being ‘valid’ to its Decision in March 2024 was 29 weeks for s78 planning appeals and 18 weeks for householder appeals (Source: Annex B of PINS statistical tables published 25/04/24).
Enforcement appeals by written reps in March 2024 had a median timescale of 59 weeks. Hearings and inquiries generally take longer, but with a smaller number of cases the averages can be misleading. Full details are on the Planning Inspectorate webpage.
The experimental statistics on Ministerial Measures give a more complete picture on timescales and provide a handy picture to share with clients when they ask you, "How long?" Please note they show performance over a 12 month period so will be different from the monthly averages above.
Graph A: PINS timescales for written reps appeals, January - December 2023

Graph B: PINS timescales for hearings, January - December 2023

Graph C: PINS timescales for inquiries, January - December 2023

Appeal success rates by Inspector, LPA and development type
The annual success rates for s78 appeals, householder appeals and enforcement appeals for the 2 years ending 31st March 2023 and 31st March 2024 are available for individual Inspectors here and for each Local Planning Authority here.
To find appeals of interest to you, use the search on our Home page.
